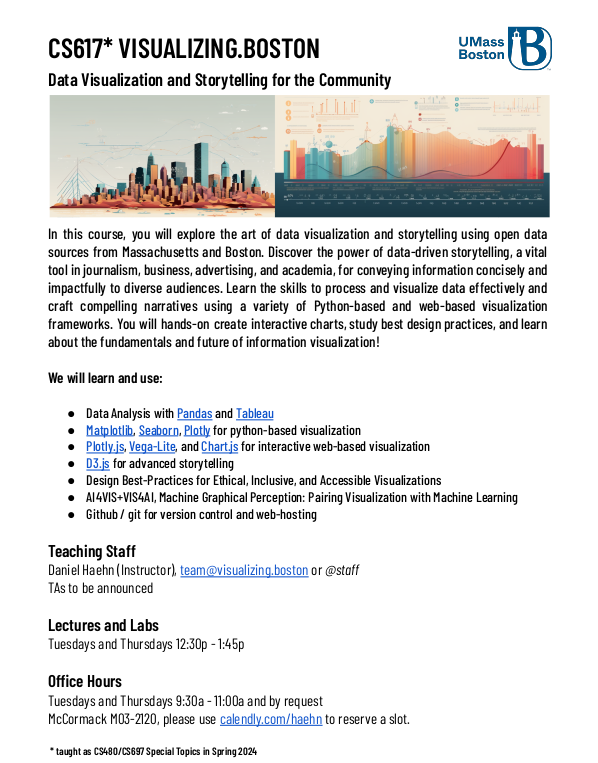
Data Visualization and Storytelling for the Community!
Explore the art of data visualization and storytelling using open data sources from Massachusetts and Boston! You will create interactive charts using design best practices, and learn about the fundamentals and future of infovis!